Quickstart
The easiest way to get started is the "Getting Started" notebook, which you can also run directly in Google Colab:

If you have cloned the repository, start it locally via Pixi:
pixi run notebook
The notebook task uses the examples environment. Select a different named platform when
needed, such as --platform linux-64-cpu for CPU-only Linux or
--platform linux-64-cuda-126 for CUDA 12.6. Platforms and environments are defined in
pyproject.toml.
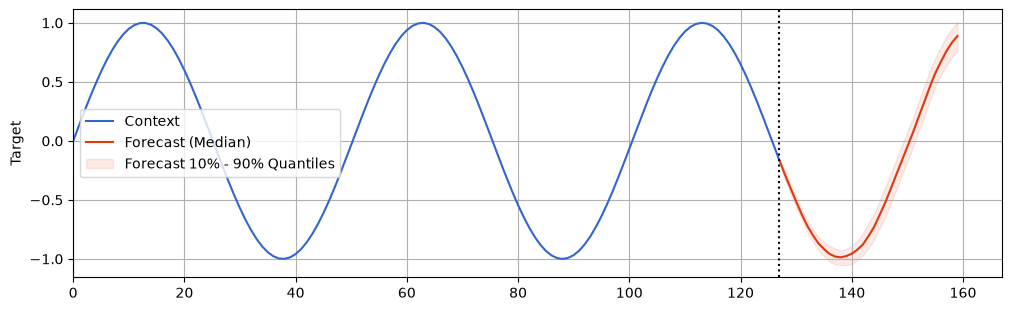
Minimal usage: predicting a simple sine wave
import torch
from tirex2 import TimeseriesType, load_model
from tirex2.plotting import plot_multivariate  # requires matplotlib to be installed

# load model
model = load_model("NX-AI/TiRex-2", device="cpu")  # use `device="cuda"` if cuda is available

# generate data - target expects time series of shape (n_targets, context_length)
context = torch.sin(torch.arange(128).float() / 8)
ts = TimeseriesType(target=context.unsqueeze(0), past_covariates=None, future_covariates=None)

# perform forecast - each forecast is of shape (n_targets, 9 quantiles, prediction_length)
forecast = model.forecast([ts], prediction_length=32, output_type="numpy")[0]

# visualize result
fig = plot_multivariate(ts, forecast, engine="matplotlib")
fig.show()
Covariate example
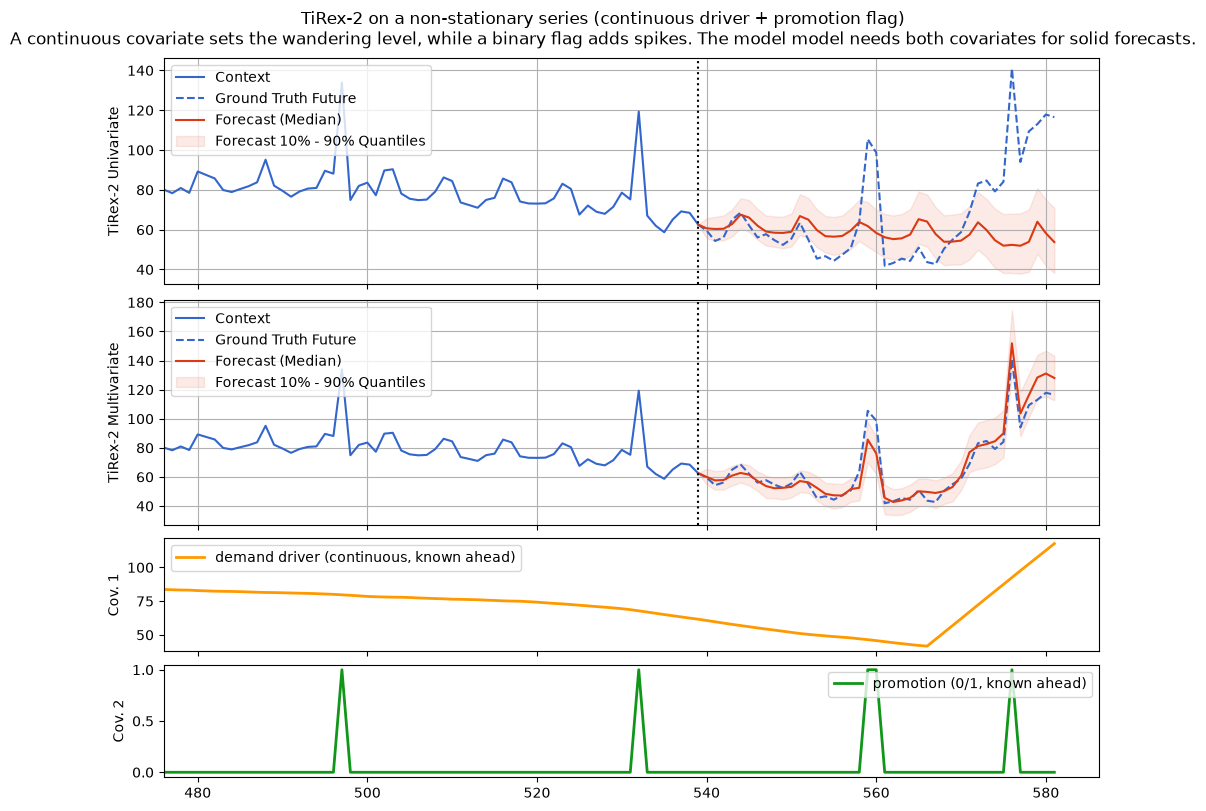
This example originates from the "Getting Started" notebook, showing the value of additional covariates.
from tirex2 import load_model
from tirex2.demo import Demo, plot_demo_forecast

# load model
model = load_model("NX-AI/TiRex-2", device="cpu")  # use `device="cuda"` if cuda is available

# load data
demo = Demo.create_nonstationary_demo()
ts_univariate = demo.to_timeseries_type(include_covariates=False)
ts_multivariate = demo.to_timeseries_type(include_covariates=True)

# perform forecast - each forecast is of shape (n_targets, 9 quantiles, prediction_length)
forecasts = model.forecast(
    timeseries=[ts_univariate, ts_multivariate],
    prediction_length=demo.horizon,
    output_type="numpy",
)

# visualize result
fig = plot_demo_forecast(demo, *forecasts, engine="matplotlib")
fig.show()
Next steps
- Forecasting — univariate and multivariate forecasting in depth.
- Covariates — past and future-known covariates.
- Streaming — what's open-source and what's PRO-only.
- API reference — full signatures and parameters.